


-
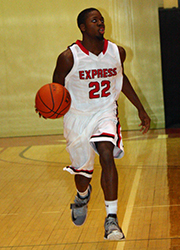
- Height:
- 6-0
-
- Weight:
- 180
-
- Year:
- Jr.
-
- Hometown:
- Ocala, Fla.
-
- High School:
- Lake Weir
-
- Position:
- G
-
- gp
- 25
-
- pts/g
- 8.9
-
- fg %
- 50.0
-
- 3pt %
- 16.7
-
- ft %
- 56.4
-
- reb/g
- 3.8
-
- a/g
- 3.0
Bio
 2012-13: Played in all 27 games on the season for the
Express, earning 26 starts...Led the team with 67 assists while
also contributing 32 steals...Posted a 1-to-1 assist/turnover ratio
on the year...Broke the century mark in rebounding, pulling down
109 total boards on the year...Shot at a 45.3% clip (73-for-161) to
lead the team amongst qualifying players...Posted a season-best 17
points twice on the year (vs. Grove City, 11/17, SUNYIT,
1/27)...Was 7-for-8 against Grove City on Nov. 17...Posted six
assists against Keystone on Nov. 20...Recorded 13 points against
Brockport St. on Dec. 30...Notched four assists at Keuka on Jan.
16...Recorded his first double-double at Wells on Jan. 27, scoring
17 points while chipping in 11 rebounds...Also added a season-best
seven assists against the Wildcats...Recorded at least four
rebounds in each of his final eight games on the year...Scored at
least 13 points in three of his final four games of the season for
Wells.
2012-13: Played in all 27 games on the season for the
Express, earning 26 starts...Led the team with 67 assists while
also contributing 32 steals...Posted a 1-to-1 assist/turnover ratio
on the year...Broke the century mark in rebounding, pulling down
109 total boards on the year...Shot at a 45.3% clip (73-for-161) to
lead the team amongst qualifying players...Posted a season-best 17
points twice on the year (vs. Grove City, 11/17, SUNYIT,
1/27)...Was 7-for-8 against Grove City on Nov. 17...Posted six
assists against Keystone on Nov. 20...Recorded 13 points against
Brockport St. on Dec. 30...Notched four assists at Keuka on Jan.
16...Recorded his first double-double at Wells on Jan. 27, scoring
17 points while chipping in 11 rebounds...Also added a season-best
seven assists against the Wildcats...Recorded at least four
rebounds in each of his final eight games on the year...Scored at
least 13 points in three of his final four games of the season for
Wells.
PRIOR TO WELLS: 2010 graduate of Lake Weir HS in Ocala,
Fla...Played basketball for the Hurricanes under coaches Mike
Sarber and Buddy Karolev...Was selected as the District 4A Player
of the Year...Also named ESPN Radio Player of the Week...Earned
Most Valauable Player recognition in 2009-10...Was the county
leader in steals, assists and points...Ranked as a top-10
underclassman in North Central Florida from 2006 to 2009...Was
dubbed "Mr. Assists" from 2008 to 2010.
PERSONAL: Son of Lewis Dickerson and Peggie
Dickerson...Sister of Myna...Business major...Enjoys weight
training, listening to music and eating take out...Aspires to claim
the North Eastern Athletic Conference title with the men's
basketball team...Also aspires to become a businessman.
| Minutes | Total | 3-Point | F-Throws | Rebounds | |||||||||||||||||||||
| Year | gp-gs | min | avg | fg | fga | pct | fg | fga | pct | ft | fta | pct | off | def | tot | avg | pf | fo | ast | t/o | blk | stl | pts | avg | |
| 2012-13 | 27-26 | 727 | 26.9 | 73 | 161 | .453 | 0 | 7 | .000 | 34 | 50 | .680 | 42 | 67 | 109 | 4.0 | 61 | 2 | 67 | 67 | 1 | 32 | 180 | 6.7 | |
| TOTAL | 27-26 | 727 | 26.9 | 73 | 161 | .453 | 0 | 7 | .000 | 34 | 50 | .680 | 42 | 67 | 109 | 4.0 | 61 | 2 | 67 | 67 | 1 | 32 | 180 | 6.7 | |
Player Profile
| Overall | Conf | |||
|---|---|---|---|---|
| Games | 25 | 18 | ||
| Games started | 25 | 18 | ||
| Minutes | 673 | 513 | ||
| Minutes per game | 26.9 | 28.5 | ||
| FG | 82-164 | 54-114 | ||
| FG Pct | 50.0 | 47.4 | ||
| 3PT | 1-6 | 0-2 | ||
| 3PT Pct | 16.7 | 0.0 | ||
| FT | 57-101 | 41-73 | ||
| FT Pct | 56.4 | 56.2 | ||
| Off rebounds | 29 | 21 | ||
| Def rebounds | 66 | 52 | ||
| Total rebounds | 95 | 73 | ||
| Rebounds per game | 3.8 | 4.1 | ||
| Personal fouls | 54 | 34 | ||
| Disqualifications | 2 | 1 | ||
| Assists | 75 | 59 | ||
| Turnovers | 64 | 42 | ||
| Assist to turnover ratio | 1.2 | 1.4 | ||
| Steals | 28 | 22 | ||
| Blocks | 1 | 1 | ||
| Points | 222 | 149 | ||
| Points per game | 8.9 | 8.3 | ||
| Points per 40 min | 13.2 | 11.6 | ||
Game Log - Shooting
| Date | Opponent | Score | gs | min | fg | pct | 3pt | pct | ft | pct | pts |
|---|---|---|---|---|---|---|---|---|---|---|---|
| Nov 15 | at Keystone | L, 95-91 | 1 | 33 | 10-15 | 66.7 | 0-1 | 0.0 | 5-9 | 55.6 | 25 |
| Nov 19 | at Alfred | L, 108-70 | 1 | 21 | 3-7 | 42.9 | 0-1 | 0.0 | 0-1 | 0.0 | 6 |
| Nov 21 | Hartwick | L, 70-59 | 1 | 12 | 1-3 | 33.3 | 0-0 | - | 0-1 | 0.0 | 2 |
| Nov 23 | Ithaca | L, 71-64 | 1 | 24 | 4-6 | 66.7 | 0-0 | - | 3-5 | 60.0 | 11 |
| Nov 25 | at Cazenovia | W, 74-69 | 1 | 29 | 2-5 | 40.0 | 0-0 | - | 2-2 | 100.0 | 6 |
| Nov 30 | at Waynesburg | L, 83-66 | 1 | 29 | 1-2 | 50.0 | 1-1 | 100.0 | 5-6 | 83.3 | 8 |
| Dec 4 | at Keuka | W, 69-67 | 1 | 34 | 6-10 | 60.0 | 0-0 | - | 4-7 | 57.1 | 16 |
| Dec 7 | Cobleskill St. | W, 72-69 | 1 | 26 | 1-4 | 25.0 | 0-1 | 0.0 | 2-2 | 100.0 | 4 |
| Dec 20 | at Manhattanville | L, 84-80 | 1 | 25 | 7-11 | 63.6 | 0-0 | - | 2-3 | 66.7 | 16 |
| Jan 11 | at Penn St.-Abington | L, 72-60 | 1 | 26 | 1-2 | 50.0 | 0-0 | - | 2-4 | 50.0 | 4 |
| Jan 12 | at Gallaudet | L, 70-65 | 1 | 19 | 3-6 | 50.0 | 0-0 | - | 1-4 | 25.0 | 7 |
| Jan 14 | Alfred St. | W, 74-53 | 1 | 16 | 2-6 | 33.3 | 0-1 | 0.0 | 1-3 | 33.3 | 5 |
| Jan 17 | Lancaster Bible | L, 66-62 | 1 | 34 | 4-10 | 40.0 | 0-0 | - | 5-8 | 62.5 | 13 |
| Jan 18 | Penn St.-Berks | W, 86-78 | 1 | 35 | 3-5 | 60.0 | 0-0 | - | 6-10 | 60.0 | 12 |
| Jan 20 | SUNY Poly | W, 90-87 | 1 | 33 | 4-10 | 40.0 | 0-0 | - | 3-4 | 75.0 | 11 |
| Jan 22 | at SUNY Poly | L, 85-73 | 1 | 26 | 1-5 | 20.0 | 0-0 | - | 1-2 | 50.0 | 3 |
| Jan 25 | Cazenovia | W, 75-69 | 1 | 21 | 1-1 | 100.0 | 0-0 | - | 2-3 | 66.7 | 4 |
| Jan 28 | Morrisville St. | L, 81-70 | 1 | 34 | 6-10 | 60.0 | 0-0 | - | 0-1 | 0.0 | 12 |
| Feb 1 | Gallaudet | W, 67-51 | 1 | 27 | 3-7 | 42.9 | 0-1 | 0.0 | 2-2 | 100.0 | 8 |
| Feb 2 | Penn St.-Abington | L, 80-79 | 1 | 24 | 3-4 | 75.0 | 0-0 | - | 0-2 | 0.0 | 6 |
| Feb 4 | at Cobleskill St. | L, 60-56 | 1 | 32 | 3-8 | 37.5 | 0-0 | - | 1-4 | 25.0 | 7 |
| Feb 14 | at Penn St.-Berks | L, 86-85 | 1 | 32 | 7-8 | 87.5 | 0-0 | - | 5-10 | 50.0 | 19 |
| Feb 15 | at Lancaster Bible | L, 80-58 | 1 | 25 | 1-4 | 25.0 | 0-0 | - | 2-2 | 100.0 | 4 |
| Feb 19 | at Morrisville St. | L, 83-65 | 1 | 25 | 2-9 | 22.2 | 0-0 | - | 0-0 | - | 4 |
| Feb 22 | Keuka | L, 68-56 | 1 | 31 | 3-6 | 50.0 | 0-0 | - | 3-6 | 50.0 | 9 |
Game Log - Ball control
| Date | Opponent | Score | gs | min | off | def | reb | ast | to | a/to | stl | blk | pf | dq |
|---|---|---|---|---|---|---|---|---|---|---|---|---|---|---|
| Nov 15 | at Keystone | L, 95-91 | 1 | 33 | 0 | 2 | 2 | 4 | 2 | 2.0 | 1 | 0 | 5 | 1 |
| Nov 19 | at Alfred | L, 108-70 | 1 | 21 | 4 | 1 | 5 | 1 | 8 | 0.1 | 0 | 0 | 2 | 0 |
| Nov 21 | Hartwick | L, 70-59 | 1 | 12 | 1 | 2 | 3 | 1 | 2 | 0.5 | 0 | 0 | 1 | 0 |
| Nov 23 | Ithaca | L, 71-64 | 1 | 24 | 2 | 2 | 4 | 4 | 0 | - | 1 | 0 | 4 | 0 |
| Nov 25 | at Cazenovia | W, 74-69 | 1 | 29 | 0 | 2 | 2 | 3 | 0 | - | 2 | 0 | 4 | 0 |
| Nov 30 | at Waynesburg | L, 83-66 | 1 | 29 | 0 | 3 | 3 | 1 | 4 | 0.3 | 0 | 0 | 4 | 0 |
| Dec 4 | at Keuka | W, 69-67 | 1 | 34 | 2 | 2 | 4 | 3 | 4 | 0.8 | 4 | 0 | 1 | 0 |
| Dec 7 | Cobleskill St. | W, 72-69 | 1 | 26 | 4 | 2 | 6 | 3 | 3 | 1.0 | 1 | 0 | 2 | 0 |
| Dec 20 | at Manhattanville | L, 84-80 | 1 | 25 | 0 | 2 | 2 | 3 | 5 | 0.6 | 3 | 0 | 4 | 0 |
| Jan 11 | at Penn St.-Abington | L, 72-60 | 1 | 26 | 0 | 5 | 5 | 1 | 1 | 1.0 | 0 | 0 | 5 | 1 |
| Jan 12 | at Gallaudet | L, 70-65 | 1 | 19 | 1 | 3 | 4 | 1 | 2 | 0.5 | 1 | 0 | 2 | 0 |
| Jan 14 | Alfred St. | W, 74-53 | 1 | 16 | 1 | 2 | 3 | 2 | 1 | 2.0 | 1 | 0 | 0 | 0 |
| Jan 17 | Lancaster Bible | L, 66-62 | 1 | 34 | 2 | 5 | 7 | 3 | 0 | - | 1 | 0 | 1 | - |
| Jan 18 | Penn St.-Berks | W, 86-78 | 1 | 35 | 2 | 7 | 9 | 7 | 3 | 2.3 | 0 | 0 | 0 | 0 |
| Jan 20 | SUNY Poly | W, 90-87 | 1 | 33 | 1 | 0 | 1 | 4 | 5 | 0.8 | 3 | 0 | 0 | 0 |
| Jan 22 | at SUNY Poly | L, 85-73 | 1 | 26 | 3 | 3 | 6 | 5 | 5 | 1.0 | 0 | 0 | 0 | 0 |
| Jan 25 | Cazenovia | W, 75-69 | 1 | 21 | 0 | 1 | 1 | 1 | 3 | 0.3 | 0 | 0 | 2 | 0 |
| Jan 28 | Morrisville St. | L, 81-70 | 1 | 34 | 3 | 1 | 4 | 5 | 0 | - | 1 | 1 | 2 | 0 |
| Feb 1 | Gallaudet | W, 67-51 | 1 | 27 | 0 | 5 | 5 | 6 | 1 | 6.0 | 1 | 0 | 3 | - |
| Feb 2 | Penn St.-Abington | L, 80-79 | 1 | 24 | 0 | 5 | 5 | 2 | 1 | 2.0 | 0 | 0 | 3 | - |
| Feb 4 | at Cobleskill St. | L, 60-56 | 1 | 32 | 2 | 3 | 5 | 2 | 4 | 0.5 | 1 | 0 | 4 | 0 |
| Feb 14 | at Penn St.-Berks | L, 86-85 | 1 | 32 | 0 | 2 | 2 | 4 | 3 | 1.3 | 2 | 0 | 1 | 0 |
| Feb 15 | at Lancaster Bible | L, 80-58 | 1 | 25 | 0 | 1 | 1 | 4 | 4 | 1.0 | 2 | 0 | 2 | - |
| Feb 19 | at Morrisville St. | L, 83-65 | 1 | 25 | 1 | 2 | 3 | 4 | 2 | 2.0 | 1 | 0 | 1 | 0 |
| Feb 22 | Keuka | L, 68-56 | 1 | 31 | 0 | 3 | 3 | 1 | 1 | 1.0 | 2 | 0 | 1 | - |
Career Stats - Shooting per game
| gp | gs | min/g | fg/g | pct | 3pt/g | pct | ft/g | pct | ppg | |
|---|---|---|---|---|---|---|---|---|---|---|
| 2011-12 | - | - | - | 0.0-0.0 | - | 0.0-0.0 | - | 0.0-0.0 | - | - |
| 2012-13 | 27 | 26 | 26.9 | 2.7-6.0 | 45.3 | 0.0-0.3 | 0.0 | 1.3-1.9 | 68.0 | 6.7 |
| 2013-14 | 25 | 25 | 26.9 | 3.3-6.6 | 50.0 | 0.0-0.2 | 16.7 | 2.3-4.0 | 56.4 | 8.9 |
| 2014-15 | 23 | 16 | 22.0 | 2.3-5.1 | 45.8 | 0.0-0.1 | 0.0 | 1.8-2.9 | 61.2 | 6.5 |
| Total | 75 | 67 | 25.4 | 2.8-5.9 | 47.2 | 0.0-0.2 | 6.7 | 1.8-2.9 | 60.6 | 7.3 |
Career Stats - Shooting totals
Career Stats - Shooting per 40 min
| gp | gs | min/g | fg/40 | pct | 3pt/40 | pct | ft/40 | pct | pts/40 | |
|---|---|---|---|---|---|---|---|---|---|---|
| 2011-12 | - | - | - | 0.0-0.0 | - | 0.0-0.0 | - | 0.0-0.0 | - | - |
| 2012-13 | 27 | 26 | 26.9 | 4.0-8.9 | 45.3 | 0.0-0.4 | 0.0 | 1.9-2.8 | 68.0 | 9.9 |
| 2013-14 | 25 | 25 | 26.9 | 4.9-9.7 | 50.0 | 0.1-0.4 | 16.7 | 3.4-6.0 | 56.4 | 13.2 |
| 2014-15 | 23 | 16 | 22.0 | 4.3-9.3 | 45.8 | 0.0-0.2 | 0.0 | 3.2-5.3 | 61.2 | 11.8 |
| Total | 75 | 67 | 25.4 | 4.4-9.3 | 47.2 | 0.0-0.3 | 6.7 | 2.8-4.6 | 60.6 | 11.6 |
Career Stats - Ball control per game
| gp | gs | mpg | off/g | def/g | reb/g | pf/g | dq/g | ast/g | to/g | a/to | stl/g | blk/g | |
|---|---|---|---|---|---|---|---|---|---|---|---|---|---|
| 2011-12 | - | - | - | - | - | - | - | - | - | - | - | - | - |
| 2012-13 | 27 | 26 | 26.9 | 1.6 | 2.5 | 4.0 | 2.3 | 0.1 | 2.5 | 2.5 | 1.0 | 1.2 | 0.0 |
| 2013-14 | 25 | 25 | 26.9 | 1.2 | 2.6 | 3.8 | 2.2 | 0.1 | 3.0 | 2.6 | 1.2 | 1.1 | 0.0 |
| 2014-15 | 23 | 16 | 22.0 | 1.3 | 1.7 | 3.1 | 1.7 | 0.1 | 2.3 | 2.2 | 1.0 | 1.1 | 0.0 |
| Total | 75 | 67 | 25.4 | 1.4 | 2.3 | 3.7 | 2.1 | 0.1 | 2.6 | 2.4 | 1.1 | 1.1 | 0.0 |
Career Stats - Ball control totals
Career Stats - Ball control per 40 min
| gp | gs | mpg | off/40 | def/40 | reb/40 | pf/40 | dq/40 | ast/40 | to/40 | a/to | stl/40 | blk/40 | |
|---|---|---|---|---|---|---|---|---|---|---|---|---|---|
| 2011-12 | - | - | - | - | - | - | - | - | - | - | - | - | - |
| 2012-13 | 27 | 26 | 26.9 | 2.3 | 3.7 | 6.0 | 3.4 | 0.1 | 3.7 | 3.7 | 1.0 | 1.8 | 0.1 |
| 2013-14 | 25 | 25 | 26.9 | 1.7 | 3.9 | 5.6 | 3.2 | 0.1 | 4.5 | 3.8 | 1.2 | 1.7 | 0.1 |
| 2014-15 | 23 | 16 | 22.0 | 2.5 | 3.2 | 5.6 | 3.1 | 0.2 | 4.1 | 4.0 | 1.0 | 2.0 | 0.0 |
| Total | 75 | 67 | 25.4 | 2.1 | 3.6 | 5.8 | 3.2 | 0.1 | 4.1 | 3.8 | 1.1 | 1.8 | 0.0 |
Splits Stats - Shooting per game
| gp | gs | min/g | fg/g | pct | 3pt/g | pct | ft/g | pct | ppg | ||
|---|---|---|---|---|---|---|---|---|---|---|---|
| Event | Total | 25 | 25 | 26.9 | 3.3-6.6 | 50.0 | 0.0-0.2 | 16.7 | 2.3-4.0 | 56.4 | 8.9 |
| Conference | 18 | 18 | 28.5 | 3.0-6.3 | 47.4 | 0.0-0.1 | 0.0 | 2.3-4.1 | 56.2 | 8.3 | |
| Exhibition | - | - | - | 0.0-0.0 | - | 0.0-0.0 | - | 0.0-0.0 | - | - | |
| Location | Home | 12 | 12 | 26.4 | 2.9-6.0 | 48.6 | 0.0-0.2 | 0.0 | 2.2-3.9 | 57.4 | 8.1 |
| Away | 13 | 13 | 27.4 | 3.6-7.1 | 51.1 | 0.1-0.2 | 33.3 | 2.3-4.2 | 55.6 | 9.6 | |
| Neutral | - | - | - | 0.0-0.0 | - | 0.0-0.0 | - | 0.0-0.0 | - | - | |
| Result | Wins | 8 | 8 | 27.6 | 2.8-6.0 | 45.8 | 0.0-0.4 | 0.0 | 2.8-4.1 | 66.7 | 8.3 |
| Losses | 17 | 17 | 26.6 | 3.5-6.8 | 51.7 | 0.1-0.2 | 33.3 | 2.1-4.0 | 51.5 | 9.2 | |
| Month | November | 6 | 6 | 24.7 | 3.5-6.3 | 55.3 | 0.2-0.5 | 33.3 | 2.5-4.0 | 62.5 | 9.7 |
| December | 3 | 3 | 28.3 | 4.7-8.3 | 56.0 | 0.0-0.3 | 0.0 | 2.7-4.0 | 66.7 | 12.0 | |
| January | 9 | 9 | 27.1 | 2.8-6.1 | 45.5 | 0.0-0.1 | 0.0 | 2.3-4.3 | 53.8 | 7.9 | |
| February | 7 | 7 | 28.0 | 3.1-6.6 | 47.8 | 0.0-0.1 | 0.0 | 1.9-3.7 | 50.0 | 8.1 |
Splits Stats - Shooting totals
| gp | gs | min | fg | pct | 3pt | pct | ft | pct | pts | ||
|---|---|---|---|---|---|---|---|---|---|---|---|
| Event | Total | 25 | 25 | 673 | 82-164 | 50.0 | 1-6 | 16.7 | 57-101 | 56.4 | 222 |
| Conference | 18 | 18 | 513 | 54-114 | 47.4 | 0-2 | 0.0 | 41-73 | 56.2 | 149 | |
| Exhibition | - | - | - | 0-0 | - | 0-0 | - | 0-0 | - | 0 | |
| Location | Home | 12 | 12 | 317 | 35-72 | 48.6 | 0-3 | 0.0 | 27-47 | 57.4 | 97 |
| Away | 13 | 13 | 356 | 47-92 | 51.1 | 1-3 | 33.3 | 30-54 | 55.6 | 125 | |
| Neutral | - | - | - | 0-0 | - | 0-0 | - | 0-0 | - | 0 | |
| Result | Wins | 8 | 8 | 221 | 22-48 | 45.8 | 0-3 | 0.0 | 22-33 | 66.7 | 66 |
| Losses | 17 | 17 | 452 | 60-116 | 51.7 | 1-3 | 33.3 | 35-68 | 51.5 | 156 | |
| Month | November | 6 | 6 | 148 | 21-38 | 55.3 | 1-3 | 33.3 | 15-24 | 62.5 | 58 |
| December | 3 | 3 | 85 | 14-25 | 56.0 | 0-1 | 0.0 | 8-12 | 66.7 | 36 | |
| January | 9 | 9 | 244 | 25-55 | 45.5 | 0-1 | 0.0 | 21-39 | 53.8 | 71 | |
| February | 7 | 7 | 196 | 22-46 | 47.8 | 0-1 | 0.0 | 13-26 | 50.0 | 57 |
Splits Stats - Shooting per 40 min
| gp | gs | min/g | fg/40 | pct | 3pt/40 | pct | ft/40 | pct | pts/40 | ||
|---|---|---|---|---|---|---|---|---|---|---|---|
| Event | Total | 25 | 25 | 26.9 | 4.9-9.7 | 50.0 | 0.1-0.4 | 16.7 | 3.4-6.0 | 56.4 | 13.2 |
| Conference | 18 | 18 | 28.5 | 4.2-8.9 | 47.4 | 0.0-0.2 | 0.0 | 3.2-5.7 | 56.2 | 11.6 | |
| Exhibition | - | - | - | 0.0-0.0 | - | 0.0-0.0 | - | 0.0-0.0 | - | - | |
| Location | Home | 12 | 12 | 26.4 | 4.4-9.1 | 48.6 | 0.0-0.4 | 0.0 | 3.4-5.9 | 57.4 | 12.2 |
| Away | 13 | 13 | 27.4 | 5.3-10.3 | 51.1 | 0.1-0.3 | 33.3 | 3.4-6.1 | 55.6 | 14.0 | |
| Neutral | - | - | - | 0.0-0.0 | - | 0.0-0.0 | - | 0.0-0.0 | - | - | |
| Result | Wins | 8 | 8 | 27.6 | 4.0-8.7 | 45.8 | 0.0-0.5 | 0.0 | 4.0-6.0 | 66.7 | 11.9 |
| Losses | 17 | 17 | 26.6 | 5.3-10.3 | 51.7 | 0.1-0.3 | 33.3 | 3.1-6.0 | 51.5 | 13.8 | |
| Month | November | 6 | 6 | 24.7 | 5.7-10.3 | 55.3 | 0.3-0.8 | 33.3 | 4.1-6.5 | 62.5 | 15.7 |
| December | 3 | 3 | 28.3 | 6.6-11.8 | 56.0 | 0.0-0.5 | 0.0 | 3.8-5.6 | 66.7 | 16.9 | |
| January | 9 | 9 | 27.1 | 4.1-9.0 | 45.5 | 0.0-0.2 | 0.0 | 3.4-6.4 | 53.8 | 11.6 | |
| February | 7 | 7 | 28.0 | 4.5-9.4 | 47.8 | 0.0-0.2 | 0.0 | 2.7-5.3 | 50.0 | 11.6 |
Splits Stats - Ball control per game
| gp | gs | mpg | off/g | def/g | reb/g | pf/g | dq/g | ast/g | to/g | a/to | stl/g | blk/g | ||
|---|---|---|---|---|---|---|---|---|---|---|---|---|---|---|
| Event | Total | 25 | 25 | 26.9 | 1.2 | 2.6 | 3.8 | 2.2 | 0.1 | 3.0 | 2.6 | 1.2 | 1.1 | 0.0 |
| Conference | 18 | 18 | 28.5 | 1.2 | 2.9 | 4.1 | 1.9 | 0.1 | 3.3 | 2.3 | 1.4 | 1.2 | 0.1 | |
| Exhibition | - | - | - | - | - | - | - | - | - | - | - | - | - | |
| Location | Home | 12 | 12 | 26.4 | 1.3 | 2.9 | 4.3 | 1.6 | 0.0 | 3.3 | 1.7 | 1.9 | 0.9 | 0.1 |
| Away | 13 | 13 | 27.4 | 1.0 | 2.4 | 3.4 | 2.7 | 0.2 | 2.8 | 3.4 | 0.8 | 1.3 | 0.0 | |
| Neutral | - | - | - | - | - | - | - | - | - | - | - | - | - | |
| Result | Wins | 8 | 8 | 27.6 | 1.3 | 2.6 | 3.9 | 1.5 | 0.0 | 3.6 | 2.5 | 1.4 | 1.5 | 0.0 |
| Losses | 17 | 17 | 26.6 | 1.1 | 2.6 | 3.8 | 2.5 | 0.1 | 2.7 | 2.6 | 1.0 | 0.9 | 0.1 | |
| Month | November | 6 | 6 | 24.7 | 1.2 | 2.0 | 3.2 | 3.3 | 0.2 | 2.3 | 2.7 | 0.9 | 0.7 | 0.0 |
| December | 3 | 3 | 28.3 | 2.0 | 2.0 | 4.0 | 2.3 | 0.0 | 3.0 | 4.0 | 0.8 | 2.7 | 0.0 | |
| January | 9 | 9 | 27.1 | 1.4 | 3.0 | 4.4 | 1.3 | 0.1 | 3.2 | 2.2 | 1.4 | 0.8 | 0.1 | |
| February | 7 | 7 | 28.0 | 0.4 | 3.0 | 3.4 | 2.1 | 0.0 | 3.3 | 2.3 | 1.4 | 1.3 | 0.0 |
Splits Stats - Ball control totals
| gp | gs | min | off | def | reb | pf | dq | ast | to | a/to | stl | blk | ||
|---|---|---|---|---|---|---|---|---|---|---|---|---|---|---|
| Event | Total | 25 | 25 | 673 | 29 | 66 | 95 | 54 | 2 | 75 | 64 | 1.2 | 28 | 1 |
| Conference | 18 | 18 | 513 | 21 | 52 | 73 | 34 | 1 | 59 | 42 | 1.4 | 22 | 1 | |
| Exhibition | - | - | - | - | - | - | - | - | - | - | - | - | - | |
| Location | Home | 12 | 12 | 317 | 16 | 35 | 51 | 19 | 0 | 39 | 20 | 1.9 | 11 | 1 |
| Away | 13 | 13 | 356 | 13 | 31 | 44 | 35 | 2 | 36 | 44 | 0.8 | 17 | 0 | |
| Neutral | - | - | - | - | - | - | - | - | - | - | - | - | - | |
| Result | Wins | 8 | 8 | 221 | 10 | 21 | 31 | 12 | 0 | 29 | 20 | 1.4 | 12 | 0 |
| Losses | 17 | 17 | 452 | 19 | 45 | 64 | 42 | 2 | 46 | 44 | 1.0 | 16 | 1 | |
| Month | November | 6 | 6 | 148 | 7 | 12 | 19 | 20 | 1 | 14 | 16 | 0.9 | 4 | 0 |
| December | 3 | 3 | 85 | 6 | 6 | 12 | 7 | 0 | 9 | 12 | 0.8 | 8 | 0 | |
| January | 9 | 9 | 244 | 13 | 27 | 40 | 12 | 1 | 29 | 20 | 1.4 | 7 | 1 | |
| February | 7 | 7 | 196 | 3 | 21 | 24 | 15 | 0 | 23 | 16 | 1.4 | 9 | 0 |
Splits Stats - Ball control per 40 min
| gp | gs | mpg | off/40 | def/40 | reb/40 | pf/40 | dq/40 | ast/40 | to/40 | a/to | stl/40 | blk/40 | ||
|---|---|---|---|---|---|---|---|---|---|---|---|---|---|---|
| Event | Total | 25 | 25 | 26.9 | 1.7 | 3.9 | 5.6 | 3.2 | 0.1 | 4.5 | 3.8 | 1.2 | 1.7 | 0.1 |
| Conference | 18 | 18 | 28.5 | 1.6 | 4.1 | 5.7 | 2.7 | 0.1 | 4.6 | 3.3 | 1.4 | 1.7 | 0.1 | |
| Exhibition | - | - | - | - | - | - | - | - | - | - | - | - | - | |
| Location | Home | 12 | 12 | 26.4 | 2.0 | 4.4 | 6.4 | 2.4 | 0.0 | 4.9 | 2.5 | 1.9 | 1.4 | 0.1 |
| Away | 13 | 13 | 27.4 | 1.5 | 3.5 | 4.9 | 3.9 | 0.2 | 4.0 | 4.9 | 0.8 | 1.9 | 0.0 | |
| Neutral | - | - | - | - | - | - | - | - | - | - | - | - | - | |
| Result | Wins | 8 | 8 | 27.6 | 1.8 | 3.8 | 5.6 | 2.2 | 0.0 | 5.2 | 3.6 | 1.4 | 2.2 | 0.0 |
| Losses | 17 | 17 | 26.6 | 1.7 | 4.0 | 5.7 | 3.7 | 0.2 | 4.1 | 3.9 | 1.0 | 1.4 | 0.1 | |
| Month | November | 6 | 6 | 24.7 | 1.9 | 3.2 | 5.1 | 5.4 | 0.3 | 3.8 | 4.3 | 0.9 | 1.1 | 0.0 |
| December | 3 | 3 | 28.3 | 2.8 | 2.8 | 5.6 | 3.3 | 0.0 | 4.2 | 5.6 | 0.8 | 3.8 | 0.0 | |
| January | 9 | 9 | 27.1 | 2.1 | 4.4 | 6.6 | 2.0 | 0.2 | 4.8 | 3.3 | 1.4 | 1.1 | 0.2 | |
| February | 7 | 7 | 28.0 | 0.6 | 4.3 | 4.9 | 3.1 | 0.0 | 4.7 | 3.3 | 1.4 | 1.8 | 0.0 |